request the D50, D95 and bypass so
that the entire performance can be
evaluated in a more comprehensive
manner.
Cyclone specifications
While the cyclone diameter and
operating pressure have the strongest
influence on cut size (i.e. smaller
cyclones correspond to a smaller cut
size), the choice of an Apex diameter
is also significant in the overall
performance and general operation.
An undersized Apex will restrict the
underflow discharge rate to a point
where coarse solids are not able to
discharge at the appropriate rate. The
result is that coarse solids are then
forced to the overflow and the entire
cyclone efficiency is significantly
inhibited. Figure 3 shows three
examples of the overall cyclone
performance given increasingly
restrictive Apex diameters. The left
panel (Figure 3a) shows a
well-balanced cyclone in which the
Apex opening can readily handle
oversized flow rate. Operators can
identify this condition by the
cone-shaped or ‘spray’ discharge.
The middle panel (Figure 3b)
shows the condition where the Apex
diameter is too small for the given
solids content and flow rate exiting
the discharge. The cyclone will begin
to surge, and the ‘wobbling’ air core
causes poor sizing efficiency. The right
panel (Figure 3c) shows a more
extreme case, where ‘roping’ or
complete plugging has occurred. This
condition results in severe
misplacement of oversized material,
which can be quite costly.
Alternatively, an Apex that is too large
will pass more water to the oversized
product and more water will result in
more fines contamination, which is
also undesirable.
The appropriate Apex diameter can
be specified by targeting a specific
volume percent solids in the
underflow stream. As the previous
analysis has demonstrated, the issues
associated with poor Apex diameter
stem from insufficient volume and, as
such, the ideal specification must
reflect a volumetric balance.
Unfortunately, many coal operators
tend to deal more often with mass
percent solids, rather than volumetric
percent solids. Furthermore, the
conversion from mass to volumetric
percent solids is highly dependent on
the ash content, which can vary
widely from site to site and from
stream to stream. For example, a 50%
solids by weight underflow sample of
pure coal (RD = 1.3) would contain
about 44% solids by volume. On the
other hand, an underflow sample of
high-ash rock (RD = 2.3) would
contain about 30% solids by volume.
The slurry containing the rock would
correspond to a smaller volume flow
that would hydraulically pass through
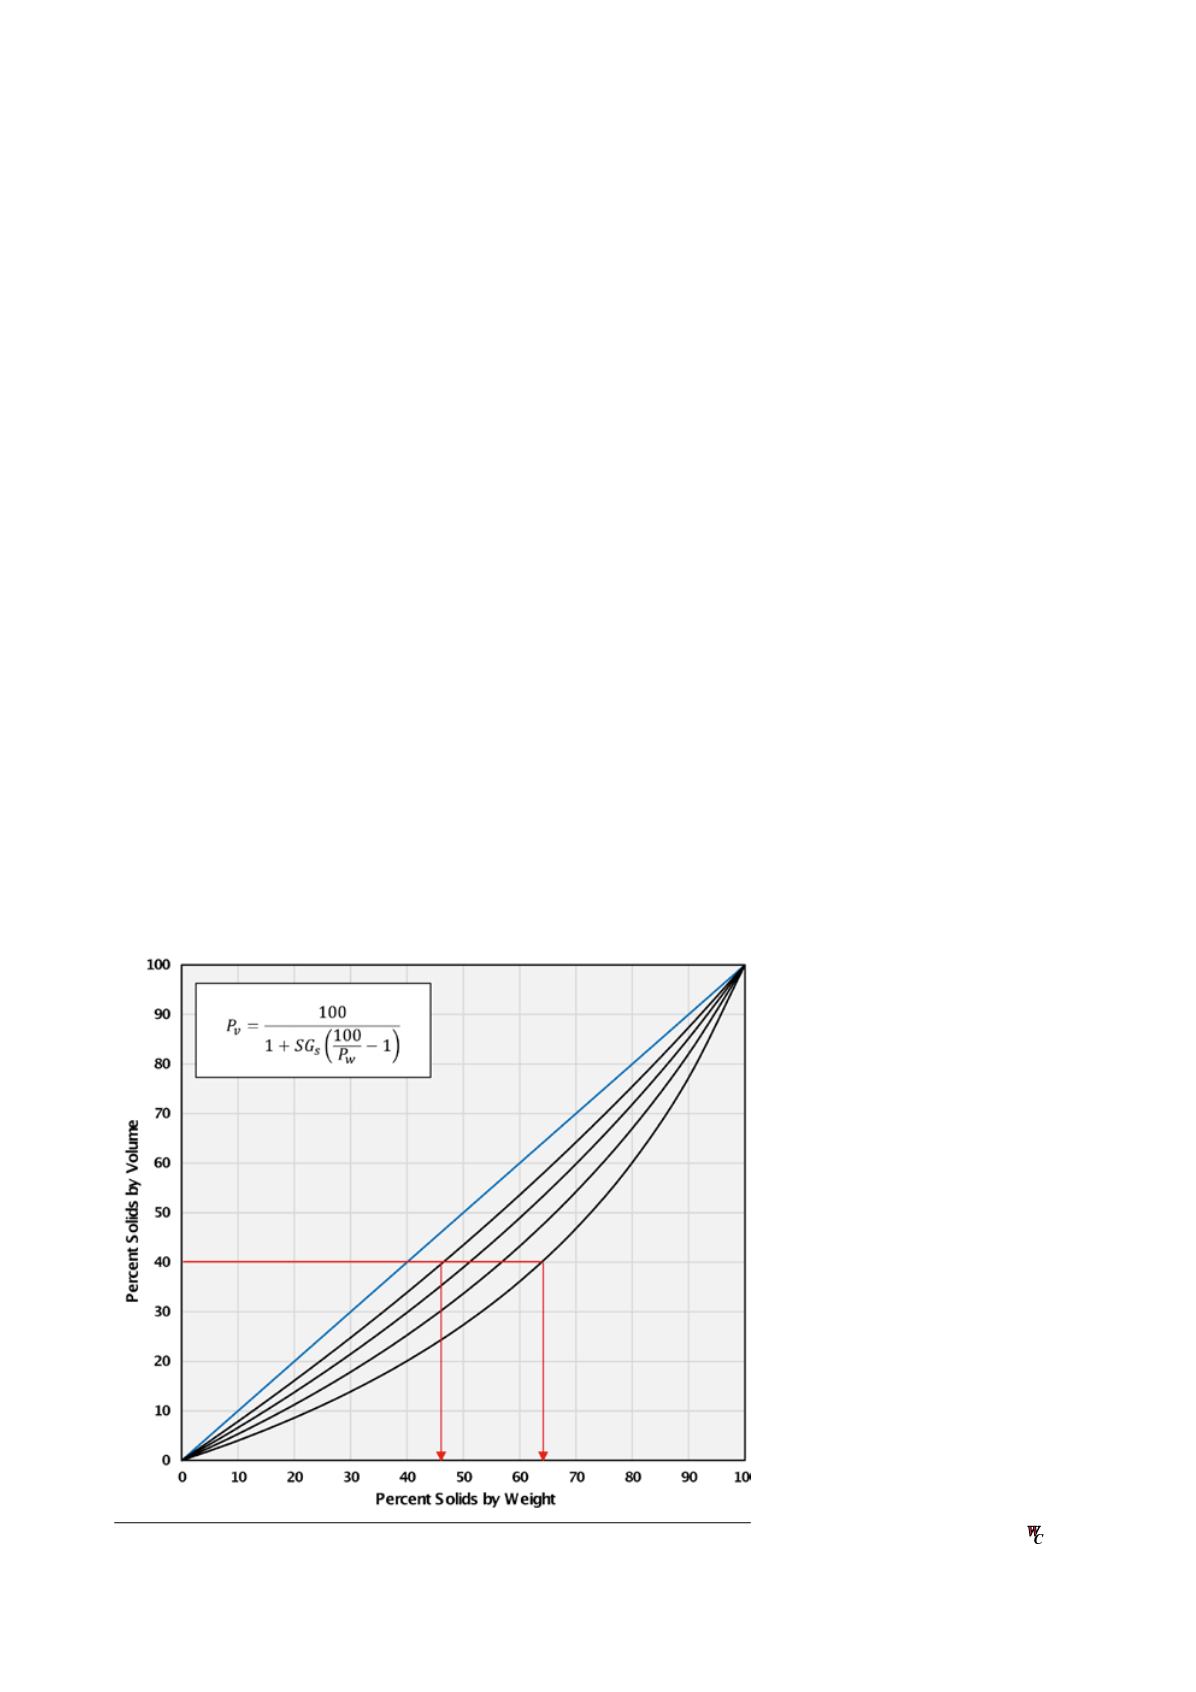
the Apex more easily. Figure 4 shows
an equation and a conversion chart
that can be used for this calculation
(note that Pv represents the volume
percent solids, while Pw represents
the weight percent solids).
Studies and cyclone manufacturers
suggest an underflow that is in the
range of 40% solids by volume is a
good target for appropriate Apex
sizing in many industrial cases. This
value can correspond to anywhere
from 45% to 65% solids by mass,
depending on the ash content of the
stream. Since feed ash can vary over
time, plant operators should
continually track these numbers to
ensure that target values are still
being met. While some sizing
inefficiencies may be due to wear or
poor pumping pressure, simple
changes in ash content can silently
deteriorate performance as well.
Conclusions
Ultra-fine size classification is an
integral component of coal
preparation that should not be
neglected. This article has shown that
poor separation efficiency in this stage
can lead to substantial economic losses
downstream. Since cyclones are often
used to classify fine particles going to
flotation from intermediate particles
going to gravity separations, a
well-controlled size separation is
needed to optimise plant performance
between the parallel cleaning stages.
The fundamental operating principles
show that improved cyclone
performance can be obtained through
proper design specifications and
suitable feed conditions. The examples
presented here, along with other
criteria, can be applied in individual
preparation plants to ensure ideal
performance is being achieved.
Figure 4. Conversion of percent solids by weight to percent solids by volume.
26
|
World Coal
|
June 2016


