replaced individually or in sets. The
useful lifespan of a tooth is affected by
a number of factors, including the tooth
material, shape and its location on the
bucket.
1
The hardness, fragmentation
and composition of the material being
excavated also influences wear.
2
Since tooth replacements present an
ongoing challenge for maintenance
optimisation, monitoring tooth wear
becomes essential for tooth change-out
planning. Manual monitoring is
labour-intensive and can only be
performed when the shovel is inactive.
An automatic, passive tooth wear
monitoring system can track tooth wear
and provide periodic updates without
requiring continuous worker attention
or shovel downtime.
In 2015, an iron mine installed the
ShovelMetrics™machine vision tooth
monitoring system on its Caterpillar
rope shovel. The system has been
continuously estimating the tooth
status, providing the wear rate and
predicting the time-to-failure (or
suggested time to replace the tooth). It
has also been collecting tooth
replacement data for analysis and
optimisation of change-outs. The
system stores all the data centrally in
the mine’s database and provides users
with a web-based interface for access to
real-time and historical data.
Cost of tooth replacement
The cost of tooth replacement can be
separated into two parts: the direct and
indirect costs. The direct cost is the teeth
and the labour, which is usually fixed
and relatively smaller. The indirect cost
is from lost production due to shovel
downtime, which varies depending on
production rate and net profit.
According to Knight’s study for a
copper mine, the direct and indirect
costs due to an unplanned change-out
of a tooth set are about US$3000 and
US$38 368 respectively, resulting in a
total cost of US$41 368.
3
For the iron mine in this case study,
with a production rate of 39 240 tpd, an
average change-out time of 47 min. and
a net profit of US$20/t, the lost
production due to an unplanned
change-out of a set of teeth is estimated
to be US$25 505. Adding the direct costs
brings the total cost to an estimated
US$28 505 per change-out.
While unplanned change-outs are
sometimes unavoidable in practice, the
occurrences can be significantly reduced
with good planning, optimal
replacement intervals and continuous
tooth wear monitoring.
Case study of optimal
replacement intervals
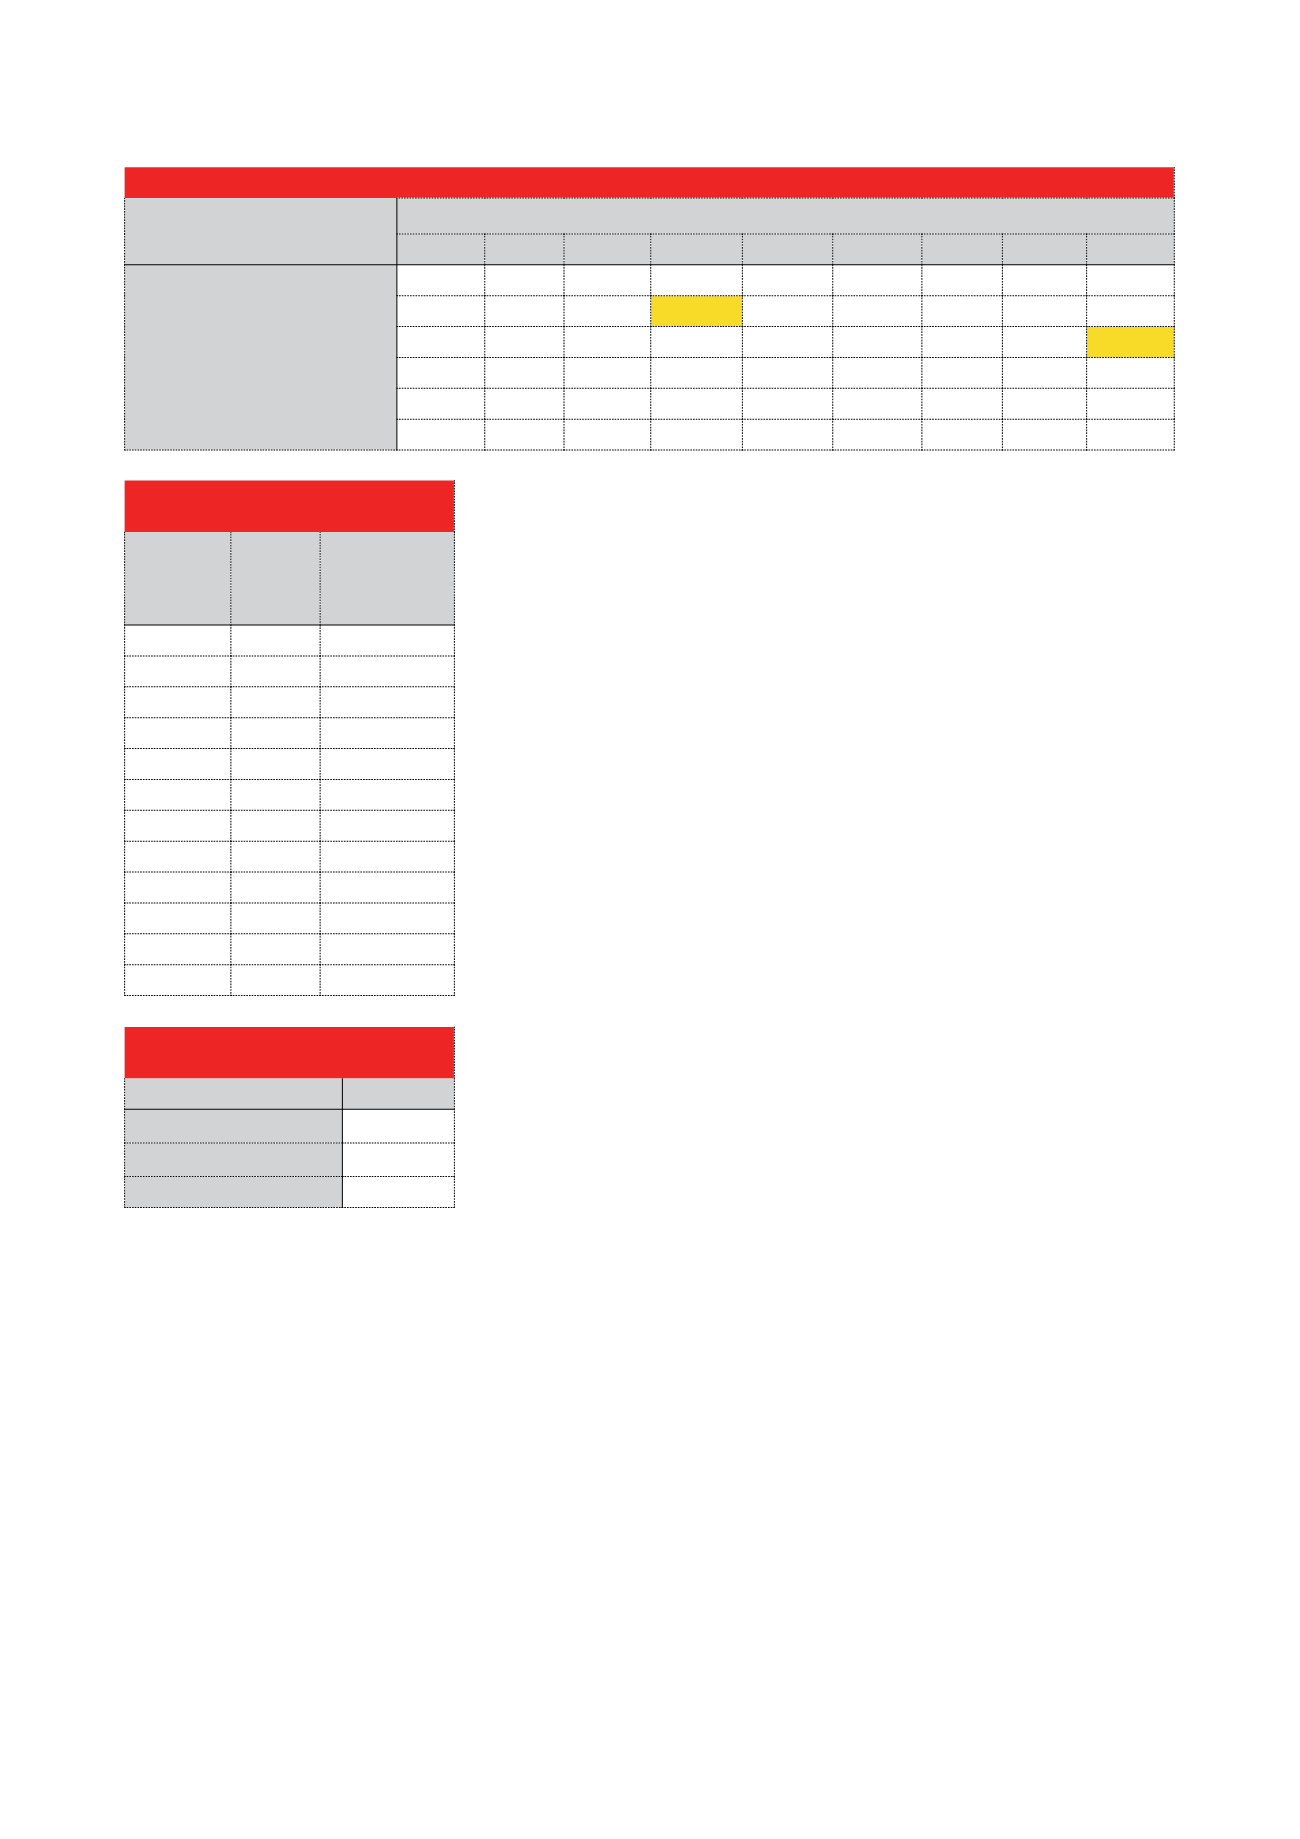
Tooth replacement data for the opencast
iron ore operation was collected over a
period of 67 days. For each position of
the teeth on the bucket, the
corresponding number of days the tooth
lasted before being changed was
recorded and is summarised in Table 1.
From the data collected, it is evident
that the middle teeth have a higher wear
rate and are replaced more frequently
than the outer teeth. Two teeth broke off
only one day after being replaced at
tooth positions #4 and #9 (highlighted in
yellow in Table 1). A tooth breaking off
shortly after it was installed may
indicate that the tooth was not properly
installed. In total, 30 teeth were replaced
over the 67 days. The distribution of the
tooth failures are calculated in Table 2.
The Weibull distribution is
commonly used in component reliability
or survivability studies due to its great
flexibility and versatility.
3
Ft=1-
e-t-tηβ0 t-t0
Where: β is the shape factor, η is the
scale factor or ‘characteristic life’,
t
0 is
the failure-free interval. If
t
0 is 0, this
function is called 2-parameter Weibull
model.
The 2-parameter model is adopted in
this scenario for simplicity. The failure
rate data of the teeth fit into the
2-parameter Weibull model for the
cumulative distribution functions (CDF).
Table 3 shows the results of
corresponding model parameters and
correlation coefficients.
The probability distribution given by
the Weibull model is shown in Figure 1.
Table 1. Tooth lasting during 67 days
Tooth position
1
2
3
4
5
6
7
8
9
Days before change-out
28
24
37
31
31
31
6
37
7
6
1
6
6
15
15
30
15
5
15
15
9
13
1
9
6
9
9
24
15
9
Table 2. Failure rate for all teeth in the
data set
Number of
days before
change-out
Number
of teeth
replaced
Accumulated
failure rate as a
percentage of
all failures
1
2
6.67%
5
1
10%
6
5
26.67%
7
1
30%
9
5
46.67%
13
1
50%
15
6
70%
24
2
76.67%
28
1
80%
30
1
83.33%
31
3
93.33%
37
2
100%
Table 3. Weibull parameters for CDF
function fitted to the tooth failure data.
All teeth
β
(shape factor)
1.3453
η
(scale factor)
16.68
Correlation coefficient
0.9064
28
|
World Coal
|
December 2015


