The overall cost of replacing dipper
teeth is calculated as the direct cost of
the teeth and labour, plus the
opportunity cost of lost production
associated with an unplanned
change‑out. The expected cost is equal to
the percentage of teeth likely to fail
multiplied by the cost of an unplanned
change-out, plus the percentage of teeth
likely to survive, multiplied by the cost
of a planned change-out.
The modified cost function by
Knights and Segovia considers that only
a certain fraction (α percent) of these
change-outs will be unplanned.
4
Expected cost/day =
FtpCf
+1-
FtCpFtpMtp
+1-
Ftptp
Where
tp
is the change-out interval,
Ftp
is the failure rate,
Cf
and
Cp
are the
unplanned and planned costs of
changing out a tooth set,
Mtp
is the
mean life of the teeth that fail.
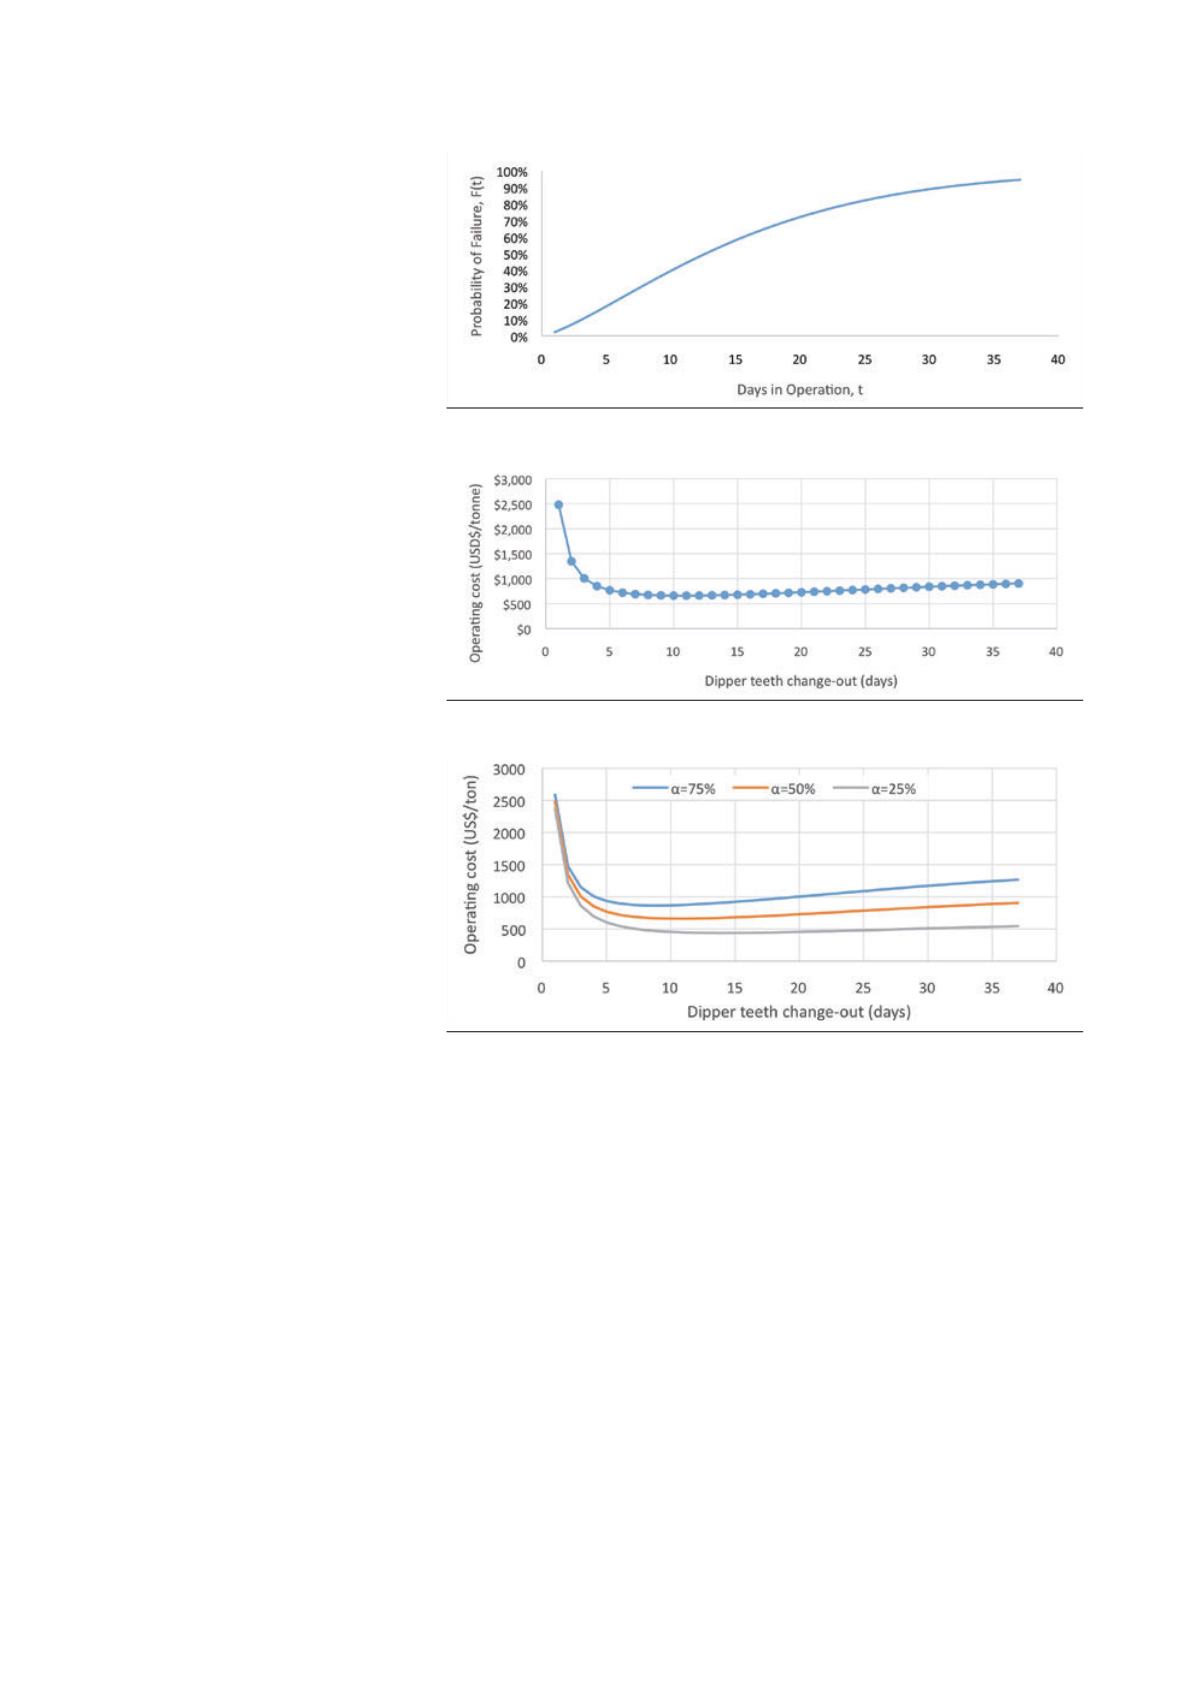
Figure 2 shows the tooth
replacement cost per tonne excavated
as a function of the replacement
interval, assuming that 50% of the
failed teeth are changed in a planned or
in an opportunistic way, which does not
incur production losses. As calculated
earlier, the planned replacement costs
for the tooth set are estimated to be
US$3000 and the unplanned
replacement costs are estimated to be
US$28 505. The mean life of the teeth
that fail
Mtp
, in this case, was 15.5 days.
Using this method, the minimum
replacement cost is US$660/day and
occurs with a replacement interval of
eleven days. However, the graph has a
shallow minimum cost/day curve and
group replacement could be extended
to 15 days for a total tooth replacement
cost of US$680/day. Compared with an
interval of 20 days and 30 days, the
savings would be US$20 000 and
US$52 000/yr, respectively.
Furthermore, it is interesting to see
how the curve (in Figure 3) changes
when α (the percent of these
change outs will be unplanned) varies.
When the percentage of unplanned
change outs is reduced, the minimum
cost/day curve becomes shallower and
wider, allowing additional days
without increasing the overall cost
significantly.
Machine vision based
tooth wear monitoring
system
After the machine vision tooth wear
monitoring system was installed on
the shovel, tooth length data was
manually measured by the mine crew
for all nine teeth of the shovel bucket
to determine the accuracy of the
system.
The ShovelMetrics™ Tooth Wear
Monitoring System uses a rugged
camera mounted on the boom of a
rope shovel or on the stick of a
hydraulic face shovel, to obtain a clear
view of the shovel bucket and its
teeth. As the shovel is operating, the
onboard processing unit continuously
analyses the incoming video to
determine the changes in tooth
length. During typical shovel
operation, a new image is obtained
every 2 – 10 min., which is more than
sufficient to accurately extract tooth
wear trends.
These manual measurements were
used as the ground truth to compare
with the automatic measurements
made by the ShovelMetrics™ system.
Figure 4 shows two images that were
automatically captured by the
ShovelMetrics™ Tooth Wear
Monitoring System: the first is from
before the tooth replacement on
2 February and the second is after the
tooth change. The difference in tooth
length can easily be seen in the images
and the tooth length indicators in
Figure 3. Replacement cost per day as a function at different values of
α
.
Figure 2. Replacement cost per day as a function of change-out interval.
Figure 1. Optimal replacement model for shovel teeth in an iron ore mine.
December 2015
|
World Coal
|
29


